Why Your Instagram Reach Dropped in 2026 (and How to Fix It)
Instagram reach dropped? Most declines are structural, not punishment. Diagnose the seven real causes, run the math, and rebuild reach over 30 days.
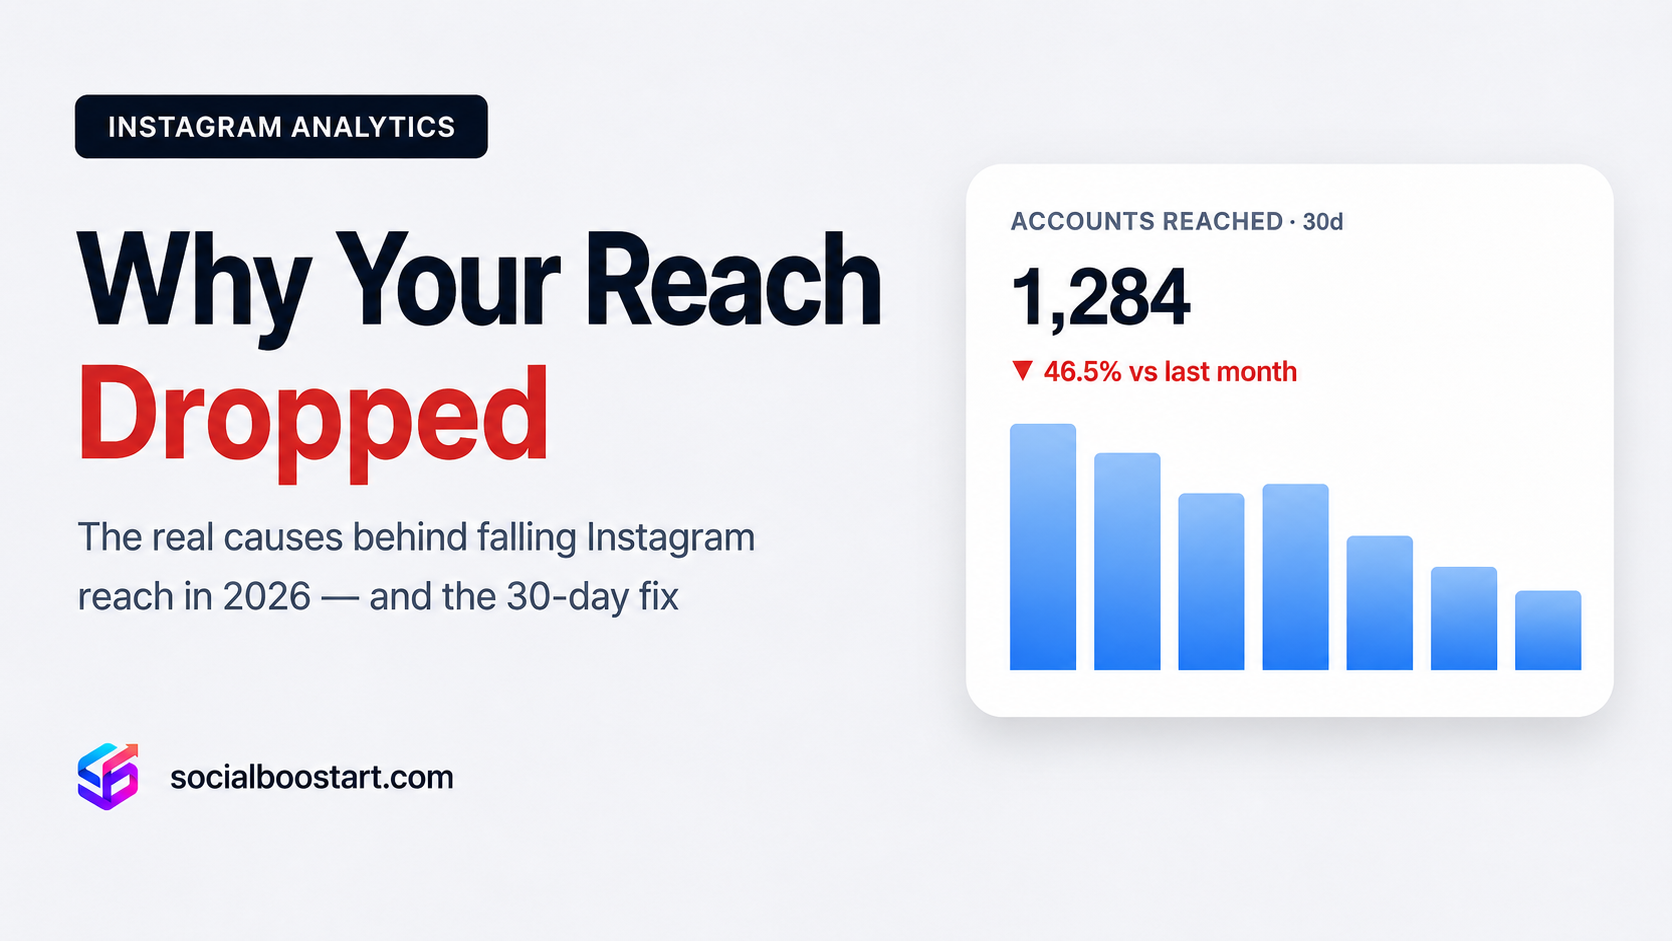
The message always arrives in the same shape: "My Instagram reach dropped off a cliff. I didn't change anything. Am I shadowbanned?" Nine times out of ten the answer is no. Reach is not an allowance the platform hands you and then confiscates. It is the output of a ranking system that re-decides, post by post, how many people should see something and which people those should be. When the output changes, an input changed too — the format, the hour you published, how many people forwarded it to a friend, how often you showed up, or what the system currently believes your account is about.
This is a diagnosis framework, not a list of hacks. We will walk through the structural reasons reach falls in 2026 — roughly in order of how often they are the real cause — show the arithmetic that makes a "drop" sometimes a complete illusion, and finish with a 30-day recovery plan you can actually run. Open Insights before you start; you will need real numbers.
One ground rule: every benchmark and percentage range below is an estimate drawn from patterns across many accounts, not a published statistic. Use them as sanity checks, never as targets.
Step Zero: Confirm the Drop Is Real Before You Diagnose It
Most "reach collapse" panics start with one bad post placed next to one good post. That comparison is close to meaningless, because distribution on Instagram is heavily skewed: a small share of posts pull outsized reach and the median post sits well below the mean.
Do this instead. Split the last 90 days into three 30-day blocks and record, for each, total posts, median reach per post, and reach from non-followers. Compare median to median. Three things separate a real problem from normal variance:
- Duration. A two-week dip is noise. A six-week decline across a dozen posts is a trend.
- Breadth. If Reels fell but carousels held, that is a format problem, not an account problem.
- Direction of the mix. If follower reach fell while non-follower reach rose, you have a measurement problem, not a reach problem.
The Biggest Cause: Feeds Became Recommendation-Driven
The most important structural change of recent years is that the main feed and Reels tab are no longer follower-first. A large and growing share of what a user sees comes from accounts they do not follow, surfaced by recommendation systems scoring predicted watch-through, likes, saves and — most importantly — sends. Instagram's own official help resources describe recommendations as a distinct surface with its own eligibility rules.
The consequence catches almost everyone out. When a post is pushed mainly into recommendations it is shown to cold audiences, so the system tests in small batches and expands only if early signals hold. Meanwhile your followers may see it later, less often, or not at all — because feed ranking now competes your post against recommended content instead of automatically slotting it in. Follower reach falls, non-follower reach rises, and the number most creators stare at — reach as a percentage of followers — becomes a worse proxy for performance every year.
Worked example: the follower-reach illusion
Take an account with 12,000 followers.
- Before: average reach 2,400. Follower reach ratio = 2,400 ÷ 12,000 = 20%. Of that 2,400, roughly 2,000 were followers and 400 were non-followers.
- After the shift: follower reach 1,300. Ratio = 1,300 ÷ 12,000 = 10.8%. Looks like a 46% collapse.
- But: non-follower reach went from 400 to 2,900. Total reach = 1,300 + 2,900 = 4,200, versus 2,400 before. That is a 75% increase in total reach.
This creator is having their best quarter ever and is convinced they are suppressed. Before changing anything, pull the follower vs non-follower split per post and check which line moved. If your non-follower share climbed from ~17% (400 of 2,400) to ~69% (2,900 of 4,200), the system is showing you to strangers — which is exactly what growth looks like in 2026.
Seasonality and Time-Zone Drift
Reach has a seasonal shape that has nothing to do with you. Holidays, exam periods and big sporting events pull attention away from the feed or flood it with competing content, and many accounts see a soft decline for several weeks in late summer and again at year-end. If your drop started on a calendar boundary, hold your nerve and keep publishing.
Time-zone drift is subtler and more damaging. As non-follower reach grows, your audience's geographic centre of gravity moves. An account that started domestic can end up with 40% of its followers on another continent within months, and the slot that used to be optimal is now the middle of their night. You lose the first-hour velocity that decides whether distribution widens.
How to check it in five minutes
- Open Insights → Total followers → Top locations and Most active times.
- Compare today's top three cities to a screenshot from three months ago; if you do not have one, start taking them monthly.
- If the ranking changed, re-derive your schedule from current data rather than a habit formed a year ago — our breakdown of the best time to post on Instagram by niche and time zone shows how to turn an audience map into a posting calendar.
Format Mismatch: Different Ceilings, Different Jobs
Every format has a different distribution ceiling because each is eligible for a different set of surfaces. Reels reach the Reels tab and heavy recommendation; carousels and statics live mostly in the main feed and Explore; Stories reach only existing followers. Averaging these into one "reach" number guarantees confusion.
A very common trigger for a perceived drop: an account that ran mostly Reels shifts to mostly carousels for a month, and reach halves. Nothing was penalised — the account moved from a high-ceiling surface to a lower-ceiling one. The reverse is also true: carousels often deliver higher saves and stronger follower conversion per view, so a Reels-only strategy can grow reach while flattening follows.
| Format | Primary job | Typical reach ceiling (estimate) | Signal it optimises |
|---|---|---|---|
| Reels | Cold-audience discovery | Highest; can exceed follower count many times over | Watch-through, replays, sends |
| Carousel | Depth, saves, follow conversion | Moderate — commonly a fraction of Reels reach | Saves, dwell time, swipe-through |
| Single image | Identity, announcements, cadence filler | Lowest of the feed formats | Likes, comments, profile visits |
| Story | Retention of existing followers | Followers only — no recommendation surface | Replies, taps forward, sticker interactions |
Your Insights, Decoded
This is the table to keep open while you audit. Match what you see on the left, read the middle column before you react, then apply the fix.
| What your Insights show | What it usually means | The fix |
|---|---|---|
| Follower reach down, non-follower reach up, total reach flat or up | Normal recommendation shift — not a penalty | Change the metric you track. Measure total reach and sends, not reach ÷ followers |
| Views healthy in hour one, then flatline | The test batch did not convert; retention or send rate too low to widen | Rebuild the first three seconds and the loop; test one hook variable per post |
| Reach falls only on Reels, carousels stable | Format-specific issue: audio, retention curve, or aspect ratio | Check retention graph at 1s and 3s; use original audio; keep 9:16 full-frame |
| Everything down ~30-50% for 4+ weeks, all formats | Cadence collapse or topic drift | Restore a fixed weekly schedule; return to your core subject for 15 posts |
| Sends and saves per reach halved | Content stopped being "worth passing on" | Write for a specific person to forward it to; add a concrete takeaway per post |
| Reach near zero on new posts, Explore traffic gone | Possible recommendation ineligibility | Check Account Status in the professional dashboard; remove or appeal flagged posts |
The Send Rate Problem: Losing Your "Worth Sharing" Score
If there is one signal to obsess over in 2026, it is sends per reach — how many people forwarded your post in a DM relative to how many saw it. Instagram's leadership has repeatedly pointed to sends as the clearest expression of value, because forwarding costs the user social capital. A like is cheap. Recommending something to a friend is not.
Worked example: the invisible cause
An account holds reach at 2,400 per post but the content shifted from specific to generic.
- Before: 40 sends ÷ 2,400 reach = 1.67% send rate.
- After: 18 sends ÷ 2,400 reach = 0.75% send rate.
Reach has not moved yet — but the leading indicator has halved. Two or three weeks later reach follows, and the creator blames an "algorithm update" that actually happened inside their own content. As a rough estimate, healthy educational or entertainment accounts often sit somewhere around 0.5-2% sends per reach, with breakout posts far higher; what matters is your own trend line, not the band.
Because Insights shows raw counts rather than rates, this is easy to miss. Normalising engagement against reach is exactly what an Instagram engagement calculator is for — run your last ten posts through it and you will usually find the decline started before the reach did.
How to raise send rate deliberately
- Write to one identifiable person, not "everyone in my niche" — forwardable content has an obvious recipient.
- Give one concrete takeaway per post: a number, a script, a checklist item, not general encouragement.
- End the caption on something a person would actually say to a friend, not a generic "what do you think?"
Cadence Collapse Breaks the Sampling Loop
Recommendation systems learn about your account by sampling. Each post gets a small test audience and the result updates the model of who should see you next. Post rarely and that model goes stale, so every upload is treated more like a cold start.
There is also a pure probability effect with nothing to do with ranking. Suppose roughly one post in six breaks out to about 5x your median reach. At 12 posts a month you expect around two breakouts. Drop to 5 posts a month and the expectation falls below one, so in a typical month you get zero. Your median post did not get worse; you simply bought fewer lottery tickets.
The practical floor for most accounts is 3-4 posts per week, held for at least a month before you judge anything. Consistency beats volume: 3 posts every week outperforms 12 in one week followed by three silent weeks, because the sampling loop needs regular data.
Topic Drift Confuses Your Classification
The system builds a topical fingerprint of your account from captions, on-screen text, audio and — critically — the behaviour of people who engage with you. That fingerprint decides which cold audience your next post is tested on. When you drift, it blurs.
A fitness account that posts three travel vlogs, a haul and a personal update in the same month has told the system five different things. Test audiences get less accurate, early signals weaken, distribution narrows, and reach falls across the board — including on the fitness posts, now shown to travel-curious viewers who scroll past.
The 80/20 repair
- List your last 20 posts and label each with one topic word.
- If your dominant topic is under 60% of posts, you have drifted.
- Publish 15 consecutive posts on the core topic to re-anchor the classification. Expect two to three weeks before test audiences tighten again.
- Reintroduce secondary topics at no more than one in five posts, and connect them explicitly to the core subject.
When It Genuinely Is a Guidelines Issue
This is the least common cause and the first one everyone jumps to. Real recommendation ineligibility has a distinct fingerprint: reach on new posts falls to a small fraction of your follower count almost overnight, Explore and Reels-tab traffic goes to roughly zero, and it applies to every post rather than some.
Instagram provides an Account Status section in the professional dashboard stating whether your account and individual posts are eligible to be recommended, and flagging anything that conflicts with Community or Recommendation Guidelines. Check it before theorising. Common fixable triggers include reposting others' content without meaningful transformation, borderline health and weight-loss claims, engagement-bait mechanics ("comment YES for the link"), and repeated use of watermarked third-party video.
If a post is flagged, remove or edit it, appeal where the option is offered, and give the account 7-14 days of clean original publishing. There is no button that restores reach instantly, and anyone promising one is selling you something.
The 30-Day Reach Recovery Plan
Run this in order. Do not compress it — the point is to change one thing at a time so you learn what actually moved.
Days 1-3: Audit
- Log the last 30 posts: format, publish time, reach, follower vs non-follower split, sends, saves.
- Calculate send rate and save rate per post. Find the week the rates turned, not the week reach turned.
- Check Account Status, top locations and active hours to rule out the two binary causes first.
- Benchmark a similar-sized peer in your niche with an Instagram account comparison — if their curve dipped in the same weeks, you are looking at seasonality, not your content.
Days 4-10: Stabilise
- Lock 4 posts per week at times derived from current audience data, and do not deviate.
- Post only your core topic. No experiments this week.
- Rebuild openings — the first three seconds decide whether the test batch stays. Our library of Instagram Reels hook formulas gives you patterns to test rather than guess at.
- Switch your success metric from reach-vs-followers to total reach plus send rate.
Days 11-20: Amplify the winners
- Find the two posts with the highest send rate regardless of reach. Those are your templates.
- Rebuild each with a different hook and example. Repeating a proven structure is not lazy; it reinforces classification.
- Early velocity matters most on comeback posts, because the system decides how far to widen the test batch within the first hours. Some creators support a genuinely strong post by choosing to buy Instagram views so it clears that first threshold instead of dying in a cold slot — it only helps content that already holds attention, and it is one lever among many, never a substitute for the hook.
- Use Stories to route existing followers to the new posts; Story reach is follower-only, the one surface you fully control.
Days 21-30: Measure and decide
- Compare days 21-30 to days 1-10 on median total reach, median send rate and non-follower share.
- Track weekly, not daily — an Instagram growth tracker makes the trend legible and stops you reacting to one quiet Tuesday.
- If send rate is up but reach is flat, keep going: reach lags by roughly two to four weeks.
- If both are flat after a clean 30 days, the problem is the content proposition, not distribution. Change the offer, not the schedule.
Accounts recover fastest when they stop asking "what did the algorithm do to me?" and start asking "what did this post give someone a reason to forward?" Only the second question has an answer you can act on this week.
Key Takeaways
- Check the mix before you panic. Falling follower reach with rising non-follower reach usually means total reach grew and your old ratio became obsolete.
- Sends per reach is the leading indicator. It falls weeks before reach does and is the clearest proxy for "worth passing on".
- Format sets the ceiling. Comparing carousel reach to Reels reach compares two distribution surfaces, not two levels of quality.
- Cadence is probability. Fewer posts means fewer chances at a breakout; 3-4 consistent posts a week is the practical floor.
- Topic drift blurs classification and degrades the cold audiences you get tested on. Fifteen on-topic posts is the usual repair.
- Genuine restrictions look different: near-zero reach on every post, overnight. Check Account Status first, and treat every benchmark here as an estimate.