YouTube Thumbnail CTR: The Packaging Playbook for 2026
A strategist's guide to YouTube thumbnail CTR in 2026: realistic ranges by traffic source, packaging-first workflow, Test and Compare, and why retention decides.
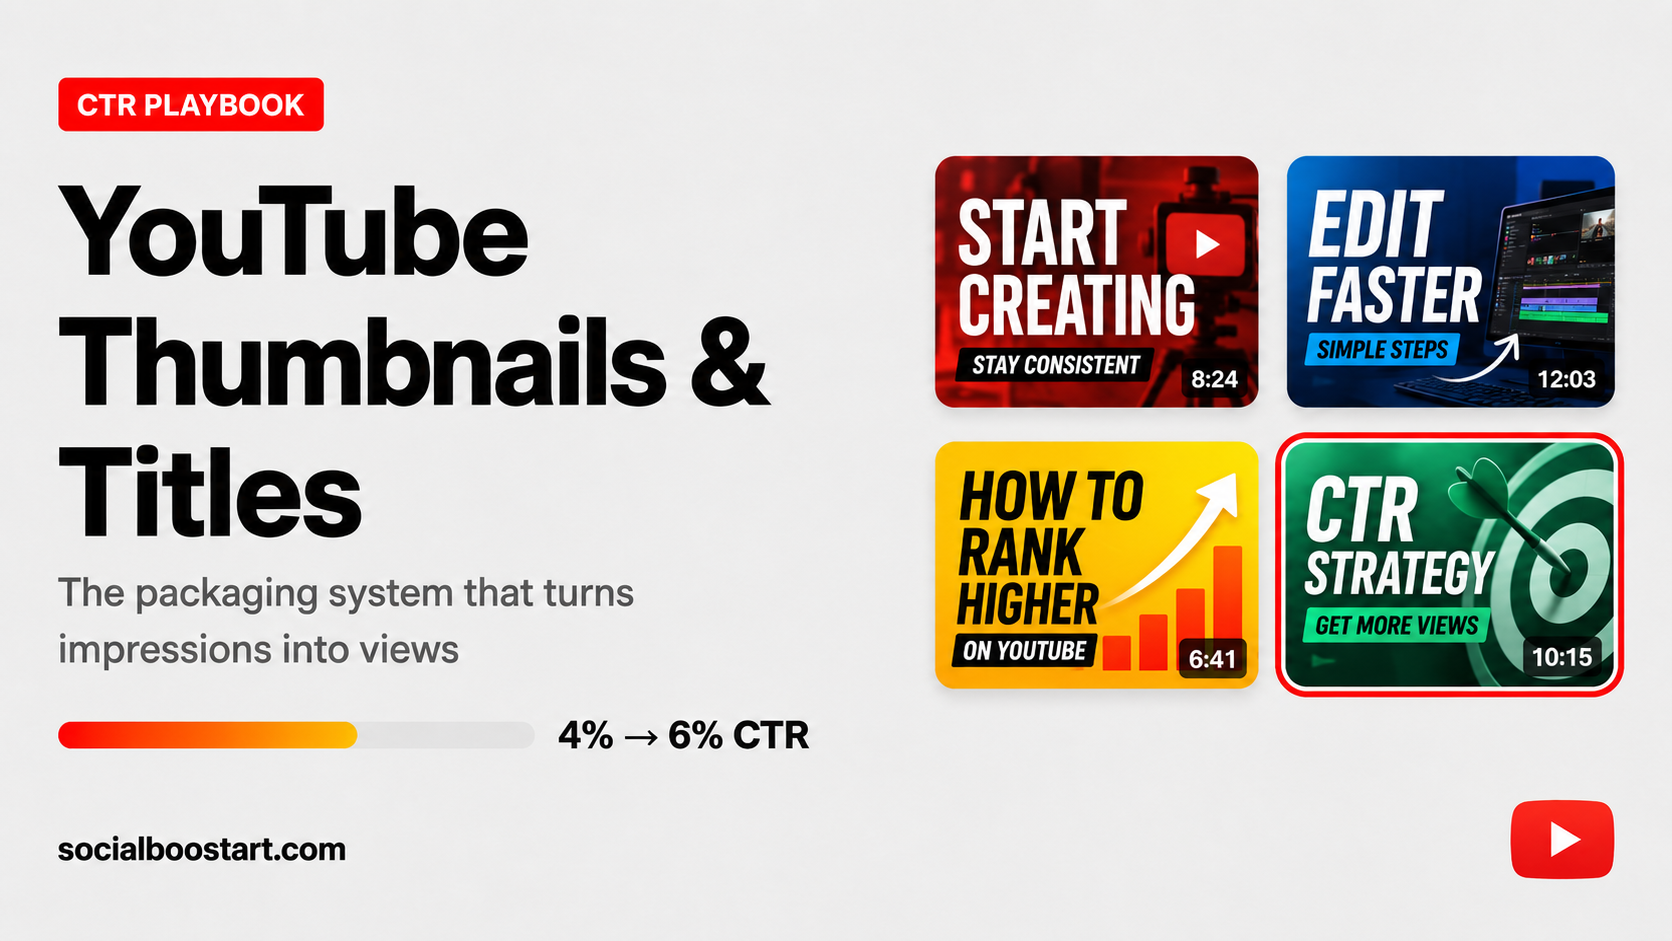
Click-through rate is the most stared-at number in YouTube Studio and the most frequently misread. Creators treat it like a school grade — 4% is bad, 8% is good — when it is really a ratio that only means something alongside two other things: the traffic source that produced the impressions, and the retention that followed the click. A 12% CTR on 300 impressions from your own subscriber feed tells you almost nothing. A 4.5% CTR on 400,000 browse impressions tells you a great deal.
Packaging matters more in 2026 than it did five years ago for a structural reason. Home and suggested surfaces are recommendation-driven, and recommendation systems work by sampling: they show a video to a small slice of a candidate audience, measure what happens, then decide whether to widen the slice. Your thumbnail and title are the entire input to the first half of that measurement. Nothing inside the video can rescue packaging that never earned the click in the first place.
This playbook covers what youtube thumbnail ctr actually measures, realistic ranges by traffic source (framed as estimates, because niche and channel size move them), design and title principles that survive at phone size, how to run Test & Compare without fooling yourself, and how to read CTR and impressions as a pair instead of in isolation.
CTR Is Half a Signal — Average View Duration Is the Other Half
YouTube's recommendation systems are optimising for something closer to satisfied watch time than raw clicks. That gives you a simple mental model: every impression YouTube spends on you is an experiment, and the return on that experiment is roughly impressions × CTR × average view duration. CTR converts an impression into a session; AVD determines whether the session was worth the impression.
This is why the two metrics have to be read together. Lifting CTR while AVD collapses produces more clicks and less value per click, and the system responds by spending fewer impressions on your next upload. Lifting AVD while CTR stays flat is quietly excellent — it means every impression you already win is producing more watch time, which is exactly the condition under which YouTube widens distribution.
A useful habit: stop tracking CTR as a standalone column and start tracking watch time per thousand impressions. If 10,000 impressions at 4% CTR and an average view duration of 3:00 generate 400 views and 1,200 watch-minutes, that is 120 watch-minutes per thousand impressions. That single number tells you more about whether a video deserves further distribution than either input does alone.
What a Healthy YouTube Thumbnail CTR Looks Like by Traffic Source
Studio reports one blended CTR by default, which is the least useful version of the number. Open the Reach tab, break impressions down by traffic source, and you will usually find your "average" is a weighted mix of two very different populations: cold browse impressions and warm search or channel-page impressions.
The ranges below are estimates drawn from how these surfaces typically behave, not published guarantees. Your niche, thumbnail style, channel size and audience loyalty all move them. Use them to spot outliers, not to score yourself.
| Traffic source | Typical CTR range (estimate) | What it is really telling you | What to optimise |
|---|---|---|---|
| Browse features (home feed) | 2%–8%, often 3%–5% at scale | Cold and semi-cold audience scrolling with no intent; the hardest surface | Thumbnail contrast, one focal subject, topic breadth |
| Suggested videos | 3%–9% | Viewer is already mid-session on a related topic; context does half the work | Continuity with the source video, curiosity in the title |
| YouTube search | 4%–14% | Explicit intent; they typed the problem you are answering | Keyword-front titles, clear promise, results-in-thumbnail |
| Channel pages | 6%–20% | Someone is deliberately browsing your catalogue | Series-consistent thumbnails, readable playlist ordering |
| Notifications / subscriptions | 5%–15% | Warm audience; low CTR here means format fatigue, not design failure | Topic variety, avoiding near-identical packaging |
| External (embeds, social, search engines) | Not reported as impressions | Traffic arrives pre-clicked; CTR is not the lever | Retention and end screens |
| Shorts feed | Not reported as CTR | Swipe-based surface with no thumbnail decision | First-frame stopping power and loop rate |
That last row matters more than creators expect. Because the Shorts feed does not generate thumbnail impressions in the same way, a channel that leans heavily on Shorts will see its blended CTR behave strangely — long-form packaging performance gets diluted by a surface where packaging barely exists. If Shorts are a meaningful share of your output, judge them by their own metrics and read our Shorts growth strategy for 2026 alongside this one rather than mixing the two dashboards.
The Arithmetic: What Two CTR Points Are Actually Worth
Percentages hide how violent small CTR movements are. Run the numbers.
Worked example one. A video receives 10,000 impressions in its first 48 hours at a 4% CTR. That is 10,000 × 0.04 = 400 views. Rebuild the thumbnail and title, and the same video on the same impressions converts at 6%: 10,000 × 0.06 = 600 views. Two percentage points is not a 2% improvement — it is a 50% increase in views from identical distribution.
Now add the compounding step. If average view duration holds at 3:00, watch-minutes go from 1,200 to 1,800. That improved return per impression is exactly the condition under which YouTube expands the sample. Suppose impressions widen by 40% to 14,000: 14,000 × 0.06 = 840 views, more than double the original 400. The CTR lift is linear; the distribution response on top of it is what makes packaging the highest-leverage hour in your production week.
Worked example two. Apply that across a publishing schedule. A channel uploading 4 long-form videos a month, each averaging 20,000 impressions, moving from 4% to 5.5% CTR: 4 × 20,000 × 0.04 = 3,200 views/month versus 4 × 20,000 × 0.055 = 4,400 views/month. That is roughly 1,200 extra views a month before any distribution expansion, or about 14,400 a year. Whether that is worth a few hundred dollars or a few thousand depends entirely on your RPM, which is why it is worth running your own figures through a YouTube earnings calculator rather than trusting a blanket per-thousand number. For the wider context on why those rates vary so much by niche and geography, our breakdown of what YouTubers actually make in 2026 unpacks the RPM side properly. All such figures are estimates.
Thumbnail Design Principles That Survive at Phone Size
Most thumbnails are designed at full size on a 27-inch monitor and consumed at roughly the width of a thumbnail on a phone. The design test is not "does this look good in Photoshop" but "does this survive being shrunk to about 15% and viewed for under a second in a column of eleven competitors."
One focal subject, never three
- Pick a single object, face, or comparison. If a viewer has to scan to work out what they are looking at, you have already lost the impression.
- Two-panel before/after works because it reads as one idea, not two subjects.
- Blur or darken the background aggressively. Depth separation is what makes a subject readable at 200 pixels wide.
Three or four words maximum
- Text on a thumbnail is a label, not a sentence. "£0 to £10k" reads; "How I built a business from nothing" does not.
- Set the type large enough that it is legible when the image is scaled to 15%. If you cannot read it, neither can a commuter on a train.
- Never repeat the title verbatim. Duplicated words waste the only two pieces of real estate you get.
Contrast that does not fight YouTube's own interface
- YouTube's chrome is white, black, grey and red. A thumbnail built from those same colours dissolves into the page.
- Teal, orange, purple, lime and warm yellow tend to hold their shape against both light and dark mode. Test both — dark mode is a very large share of viewing.
- Keep the bottom-right corner clean; the duration stamp sits there and will cover anything you put underneath it.
Faces with one unambiguous emotion
- Faces work because humans parse them pre-attentively, but only when the expression is legible. "Vaguely surprised" reads as nothing.
- Eye direction is a pointer. A subject looking at the object of the video pulls attention to it.
- If your niche is object-led — cooking, hardware, software — the object is the face. Do not force a reaction shot into a tutorial about a spreadsheet.
Titles That Pair With the Thumbnail Instead of Repeating It
The most common packaging failure is redundancy: the thumbnail says "$10,000" and the title says "I Spent $10,000 On…". You have paid twice for one idea. Treat them as two halves of a single sentence — the thumbnail carries the stakes or the visual proof, the title carries the specifics and the context.
Patterns that pair well
- Thumbnail shows the result, title supplies the constraint. Image: a finished room. Title: "I renovated this in 3 days with no tools."
- Thumbnail poses the question, title narrows it. Image: two products side by side with a question mark. Title: "The cheaper one won — here's the test data."
- Thumbnail shows the moment of failure, title promises the lesson. Curiosity plus payoff, with no deception.
Mechanical rules worth keeping
- Front-load the meaningful words. Mobile feeds truncate titles somewhere around 40–50 characters depending on device and layout, so the payload belongs at the start.
- Keep total length in the ~50–65 character band for long-form. Longer titles are not penalised, they are simply not read.
- Include the phrase a searcher would actually type, but only when the video genuinely serves search intent. Stuffing keywords into a browse-first video degrades both.
- Numbers, years and named constraints outperform abstractions. "In 30 days" beats "quickly."
Packaging First: Title and Thumbnail Before the Camera Turns On
The single change that separates channels with rising CTR from channels that plateau is sequence. Most creators film, edit, then design packaging for whatever they happened to make. Packaging-first inverts it: you write the title and sketch the thumbnail before you shoot, and you only shoot the ones that survive.
- Write the title in a document, as a real sentence, not a topic. "Camera comparison" is a topic. "The £400 camera that beat my £3,000 one" is a title.
- Sketch the thumbnail in thirty seconds — a box, a stick figure, three words. If you cannot draw it, the video has no visual idea and the thumbnail will be a screenshot with text slapped on.
- Paste your sketch and title into a mock feed alongside eight real competitor thumbnails from your niche, scaled down. Look at it for one second. If your eye does not land on yours, iterate before filming.
- Film so the thumbnail is true. If the thumbnail promises a comparison, shoot the comparison. Packaging-first is not about deception; it is about knowing what you are proving before you spend a day proving it.
- Kill ideas at the sketch stage. A concept that cannot be packaged in three words rarely becomes clickable after eight hours of editing.
Testing Thumbnails With Test & Compare — and Reading the Result Correctly
YouTube's built-in Test & Compare feature lets you upload multiple thumbnail options for the same video and rotates them across real impressions until it has enough signal to declare a preference. Availability and exact behaviour have shifted since rollout, so confirm the current rules for your channel in YouTube's official Help documentation rather than relying on a creator's summary from last year.
Two things about it are routinely misunderstood:
- It optimises for watch-time share, not raw CTR. The winner is the thumbnail that produced the largest share of watch time, which is exactly right — a thumbnail that wins clicks but attracts the wrong viewer will lose. Do not override the result because a different variant "had better CTR."
- It needs volume and time. Tests run for a period of days and split impressions between variants. On a video pulling a few thousand impressions total, a 0.3-point gap between variants is noise, not a finding. Test on your better-distributed uploads if you want conclusions you can generalise.
How to design a test worth running
- Change one concept per test, not one pixel. Face versus object. Text versus no text. Two variants that differ only in font weight will produce an unusable result.
- Write down your hypothesis before you launch. "I think the object-only version wins on browse because faces are saturated in this niche" is testable; "let's see which one does better" teaches you nothing transferable.
- Log every result in a spreadsheet with the video topic, traffic-source mix and winner. Ten logged tests become a house style; ten unlogged tests become ten coin flips.
The Clickbait Trap: High CTR With Weak Retention Is a Downgrade
Clickbait is not punished by a rule; it is punished by arithmetic. Consider two versions of the same eight-minute video, each shown 10,000 times.
Version A uses a shock thumbnail and an overstated title. CTR 8%, but viewers realise within a minute that the promise was false: average percentage viewed 22%, so AVD is 8 × 0.22 = 1:46. Views: 10,000 × 0.08 = 800. Watch-minutes: 800 × 1.77 ≈ 1,416.
Version B uses an honest, specific package. CTR 5%, average percentage viewed 48%, so AVD is 8 × 0.48 = 3:50. Views: 10,000 × 0.05 = 500. Watch-minutes: 500 × 3.83 ≈ 1,915.
Version B generates about 35% more watch time from the same impressions despite winning 300 fewer clicks — and it is Version B whose sample gets widened. The damage compounds beyond one video: viewers who bounce hard teach the system that your channel is a weak recommendation for that audience segment, which suppresses the next upload before it is even published. The workable version of curiosity is a true gap: promise something real and withhold only the answer, never the premise.
CTR and Impressions Move Together — Read Them as a Pair
A CTR number in isolation is nearly meaningless because the denominator is not fixed. YouTube actively changes who sees your thumbnail, and that change alone moves CTR without you touching the design. Four combinations, four different diagnoses:
| Pattern | Most likely cause | Correct response |
|---|---|---|
| CTR up, impressions down | Distribution narrowed to your core audience, who click reliably. The packaging is not the problem — reach is. | Widen topic appeal and check retention; do not redesign a thumbnail that is converting. |
| CTR down, impressions up | YouTube is testing you on colder audiences. A falling rate on a much larger base is often a good sign. | Check absolute views and watch time. If both are climbing, do nothing. |
| Both down | The video is being deprioritised — usually weak early retention or a topic mismatch. | Diagnose the first 30 seconds before touching packaging. |
| Both up | Expansion. The concept and the package are working together. | Document the format and make the sequel while the signal is live. |
The practical rule: never judge packaging on a metric that changed because the audience changed. Compare CTR within a single traffic source, across videos of similar age, or the comparison is invalid.
Giving a New Upload Enough Data to Be Sampled Properly
There is a real cold-start problem underneath all of this. The recommendation system cannot learn that your packaging converts until it has spent enough impressions to measure it, and small channels frequently sit below the threshold where any of these numbers are statistically readable. A video that receives 600 impressions in 48 hours will produce a CTR figure that swings wildly on a handful of clicks.
Most of the fix is editorial: publish consistently so the system has a channel-level prior to work from, use end screens and playlists to pass sessions between your own videos, and share new uploads to audiences you already own so the first cohort is warm. Where a supplemental push fits is narrow but genuine — when packaging and retention are already solid and the only missing ingredient is early volume, some creators choose to buy YouTube views to give a strong upload enough early traffic that there is something for the algorithm to sample rather than a flat line. It is worth being blunt about the limits: added views do not improve a thumbnail, do not repair a weak first thirty seconds, and cannot manufacture demand for a topic nobody wants. They only shorten the window before real behavioural data exists.
The same logic applies to channel-page conversion, which is where a surprising share of packaging performance is decided. A viewer who clicks a thumbnail, enjoys the video and then lands on a channel page with three subscribers is being given a reason to hesitate, which is why some creators pair a packaging overhaul with YouTube subscriber social proof so the channel page reads as established when new traffic finally arrives. Treat both as one lever among many — the thumbnail, the title, the first thirty seconds and the topic itself will always do more of the work, and any engagement figures quoted anywhere should be read as estimates rather than promises.
A Repeatable Packaging Routine
- Before filming: write the title, sketch the thumbnail, mock it against eight competitors at phone size. Kill the idea if it does not stand out.
- At upload: confirm the title's payload sits in the first 45 characters and the thumbnail's text is under four words.
- 48 hours in: read CTR broken down by traffic source, never blended. Note impressions alongside it.
- Day 7: if browse CTR is materially below your channel's own trailing average for the same source, launch a single-variable Test & Compare.
- Day 14: log the winner, the hypothesis and the traffic-source mix in your packaging spreadsheet.
- Monthly: review the log for patterns. After ten entries you will have a house style backed by your own data instead of somebody else's advice.
Key Takeaways
- CTR only means something next to average view duration — track watch time per thousand impressions, not clicks alone.
- Benchmark within a traffic source, never blended: browse, suggested, search and channel-page CTR live in different ranges, and all published ranges are estimates.
- Small CTR movements are large in absolute terms: 10,000 impressions at 4% is 400 views, at 6% it is 600 — and if AVD holds, the impression pool tends to widen on top of that.
- Design for phone size: one focal subject, three or four words, colours that do not blend into YouTube's white/black/red interface, and one legible emotion.
- Titles should complete the thumbnail, not repeat it — and packaging should be written and sketched before you film, not after you edit.
- Clickbait loses on arithmetic: 8% CTR at 22% retention produces less watch time than 5% CTR at 48%, and it teaches the system to stop recommending you.